| Summary:
The ACS data from the HST for the CDFS have been reduced. This page presents an early version of the imaging data and the catalogs. There are data in the BVIZ bands. The observations extend to about IAB=26.5 |
| Rationale:
VIMOS has made a number of spectral observations on the Chandra Deep Field South. The imaging data for the CDFS is of high quality, considerable extent and high angular resolution. Further the data is freely available. |
| Processing:
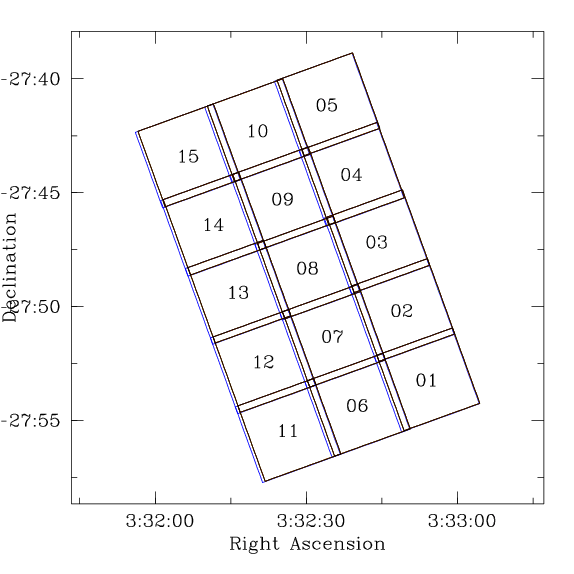
The data were retreived from ftp://archive.stsci.edu/pub/hlsp/goods/. The data at this site are detrended (flat-fielded and so on) and drizzled on a pointing by pointing basis. Each image is roughly 4000x4000 pixels. There are 15 pointings in all, with partial overlaps, as shown by the figure below. The images have also been calibrated photometrically. The obsevations are in 4 filters: (F435W, F606W, F775W, F850LP, roughly equivalent to BVIZ). The World Coordinate System of the images has been computed to a fairly high accuracy (better than 1 pixel, or 0.05 arcseconds). However, the images are not aligned in terms of pixel coordinates. In order to generate a complete catalog, the 15 images in each band were combined using Emmanuel Bertin's SWarp program into one big image. The resulting images have identical World Coordinate Systems and are registered to each other with sub-pixel accuarcy. SExtractor was run in double-image on the images to generate an I-band selected catalog. |
| The figure at right shows the layout of imaging data for the Chandra Deep Field South. The numbered, skewed boxes show the data from the Advanced Camera for Surveys on HST. Colour indicates filter. Blue=B, Green=V, Red=I, Black=Z. The VIZ data is more or less aligned. The B-band data is somewhat offset. | |
| The image at right is a BVI composite image showing a small subsection of the CDFS. Worthy of note are the high resolution in the large galaxies, and the numerous small, faint galaxies visible even in this fairly short exposure. The scale is 0.05" per pixel, very similar to the resolution of the HDF images. | 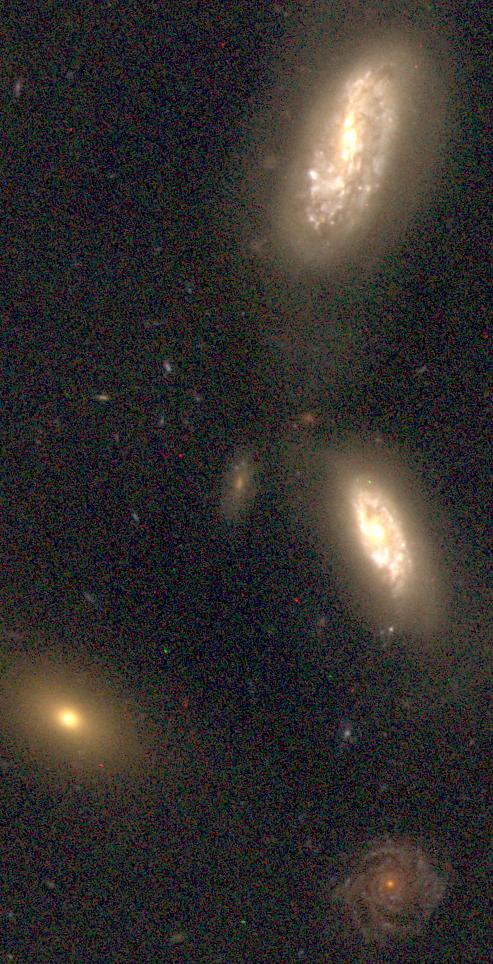 |
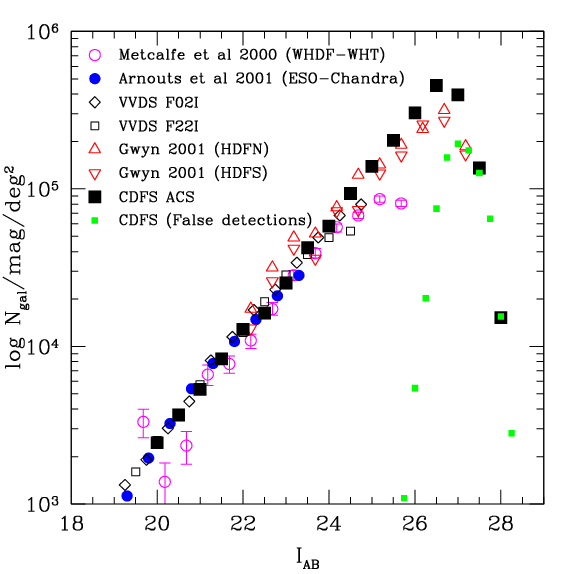
| The figure at right shows the I-band CDFS number
counts, toghether with counts from other surveys. The CDFS counts have
been have corrected for the cosmic rays in the image by throwing out all
objects whose half-light radius is less than 1.35 pixels.
The false detection rate was calculated by taking the original image,
mutliplying by -1 and run SExtractor on this negative image with the original
parameters. Since the image is negative, all detections are perforce false.
Note that the number counts for the HDF do not agree with the counts for CDFS. This is possibly because the "I-band" being plotted is slightly different in the (F814W for the HDF, F775W for the CDFS). Alternatively, it may because the cosmic ray removal was imperfect, or because of the (as yet unmasked) spurious detection on the difraction spikes of bright stars. The limiting magnitude would appear to be about IAB=26.5. |
 |
| The figure at right shows half light radius plotted against magntiude for all the detected objects in the I band ACS images. The stellar locus is visible as a horizontal band. Also visible are a large detections whose angular extent would appear to be smaller than that of a point source. The detections are spurious, mostly like cosmic rays which deposit their charge into only a few pixels. The red horizontal line at 1.35 pixels shows the cut used to exclude the majority of cosmic rays. Note that brightwards of IAB=24 (the limit of the VIMOS observations) there are fairly few cosmic rays. The vertical line at IAB=26 indicates the magnitude limit. | 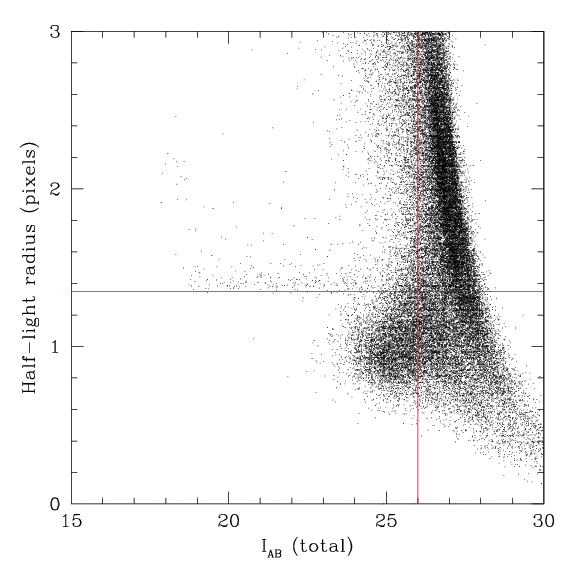 |
| The figure at right shows the spectral observations taken with VIMOS as small black dots. The red sqaures show the outline of the ACS images. | 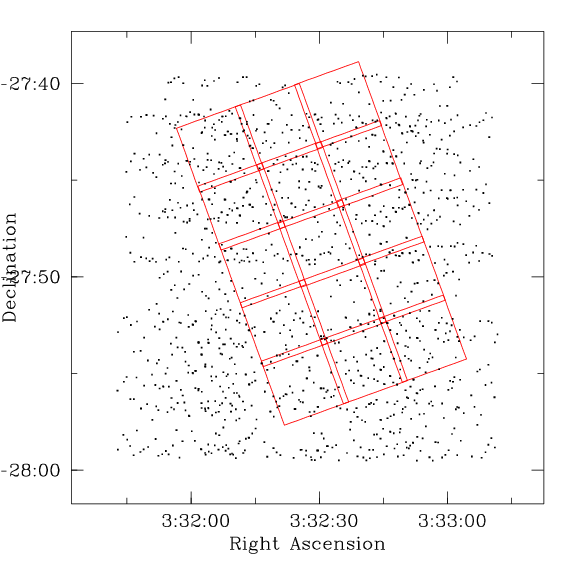 |